-
play_arrow
The Alternative One Your Modern Rock Music Radio Station!
-
play_arrow
Wild Country Radio Your Hometown Country Music Station...
-
play_arrow
Rock ‘n’ Roll Radio We Play Everything That Rocks Your World!
-
play_arrow
Yacht Rock Radio Nothing but Smooth Breezes Ahead...
-
play_arrow
New Wave Radio 80s Songs You Will Not Hear Anywhere Else!
-
 play_arrow
NextWave Broadcasting Network Advertising NextWave Broadcasting Radio Group Network
 Rational Youth - Heredity
Enjoying your curated playlist from Montreal, Canada!😎
Johnnie Superstock
Rational Youth - Heredity
Enjoying your curated playlist from Montreal, Canada!😎
Johnnie Superstock
 Public Image Ltd. - Disappointed
To New Wave Radio - The greatest!!
Public Image Ltd. - Disappointed
To New Wave Radio - The greatest!!

By NextWave Broadcasting Network · Updated October 11, 2026
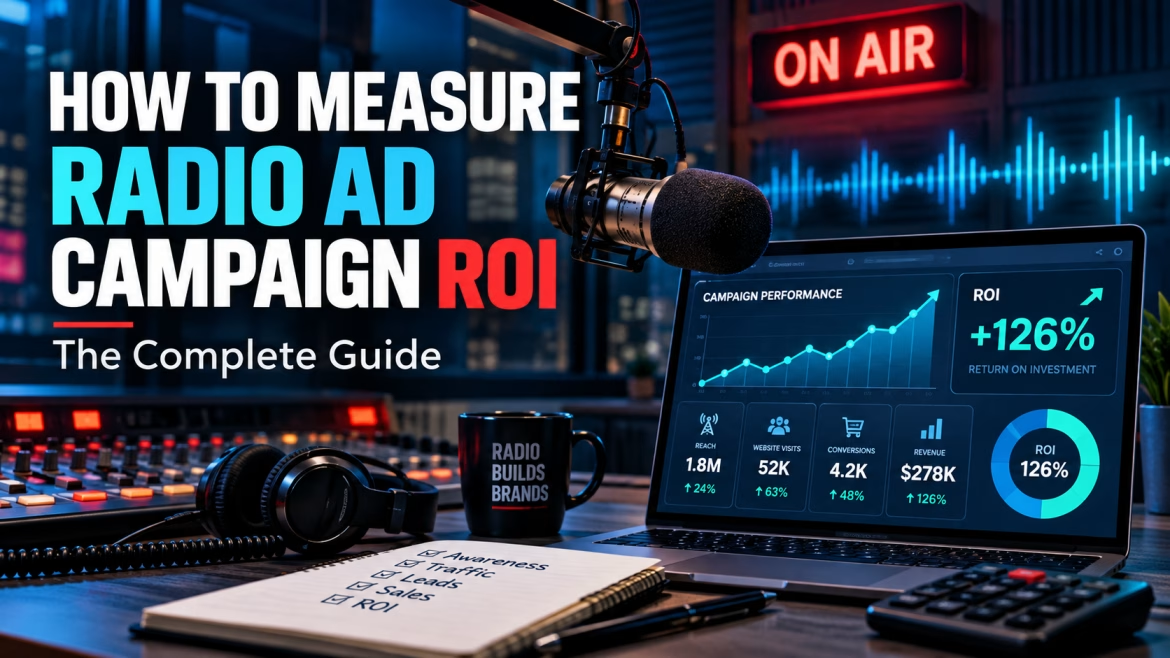
How to Measure Radio Ad Campaign ROI: The Complete 2026 Guide
To measure radio ad campaign ROI, compare the incremental gross profit the campaign produced against everything the campaign cost. In practice that means setting a pre-campaign baseline, tagging every response path (vanity URLs, promo codes, call-tracking numbers and a “how did you hear about us” question), measuring the lift above baseline during and after the flight, and then applying the formula: ROI = (incremental gross profit − total campaign cost) ÷ total campaign cost.
This guide walks through each step, shows a worked example, and explains why last-click dashboards routinely under-credit radio and streaming audio.
Key takeaways
- ROI uses incremental profit; ROAS uses incremental revenue. Know which one you are reporting.
- Set a baseline of at least 4–8 weeks before the flight so you can isolate lift.
- Give radio its own trackable response paths: vanity URL with UTMs, promo code, call-tracking number, survey question.
- Measure through the flight and several weeks afterward, because audio effects build and linger.
- Light schedules rarely produce measurable lift. Under-delivered frequency is the most common reason radio “didn’t work.”
ROI vs. ROAS: Get the Definition Right First
Most arguments about whether radio “worked” are really arguments about definitions. Before the campaign launches, agree on which of these you will report:
| Metric | Formula | What it tells you |
|---|---|---|
| ROAS (return on ad spend) | Incremental revenue ÷ media spend | How many sales dollars each ad dollar generated. Industry studies usually quote this. |
| ROI (return on investment) | (Incremental gross profit − total cost) ÷ total cost | Whether the campaign actually made money after margins, production and fees. |
| Cost per lead / acquisition | Total cost ÷ incremental leads or customers | Easy to compare against social, search and other channels. |
A campaign can show a strong ROAS and still lose money if your margins are thin, which is why ROI should use gross profit, not revenue. Include every cost: media, production, voice talent, agency or management fees and any landing-page or tracking setup.
Step 1: Set a Baseline Before the First Spot Airs
Radio is rarely the only thing driving your sales, so you need to know what “normal” looks like. Pull at least four to eight weeks of pre-campaign data for the metrics you care about:
- Website sessions, especially direct and branded organic search traffic (people who heard the ad tend to type your name or URL)
- Leads, form fills, phone calls and online sales
- Store visits or walk-ins if you track them
- Branded search queries in Google Search Console
Note seasonality and any other promotions running at the same time. If you can, compare against the same period last year as well. The cleaner your baseline, the more confidently you can attribute the lift.
Before You Start: Match KPIs to the Campaign Goal
ROI is easiest to prove when the campaign has one primary goal and a KPI that fits it. A brand-awareness flight judged on next-day sales will almost always look like a failure, while a promotion judged only on recall misses the point. Use this as a starting map:
| Primary goal | Primary KPI | Best measurement method |
|---|---|---|
| Awareness / brand building | Branded search volume, direct traffic, aided recall | Pre/post lift, brand-lift survey, Search Console trends |
| Website traffic | Sessions from Audio channel plus lift in Direct and branded Organic | GA4 with UTMs and baseline comparison |
| Lead generation | Incremental leads, cost per lead | Vanity URL, call tracking, form source field, baseline lift |
| Sales / store visits | Incremental revenue and gross profit | Promo codes, POS data, matched-market test |
| Event attendance | Tickets or RSVPs, attributed and total | Unique code, dedicated landing page, comparison with past events |
Write the goal, KPI and target number into the campaign brief before anything airs. A clear target (for example, “60 incremental leads at under $150 each”) makes the final ROI conversation simple.
Step 2: Build Trackable Response Paths Into the Creative
Give listeners an easy, memorable action that only radio is driving. Each of these creates a clean signal:
- Vanity URL – a short, spoken-friendly address (for example, yourbrand.com/rock) that 301-redirects to a landing page tagged with UTM parameters such as
utm_medium=audio. Google Analytics 4 assigns traffic with that medium to its built-in Audio channel. - Promo or offer code – unique to the radio campaign, or even to each station.
- Call-tracking number – a dedicated number that forwards to your main line and logs every call.
- “How did you hear about us?” – a required field on forms and a question your staff asks on the phone. Include each station or show by name.
- Companion display clicks – on streaming audio, banners that appear in the player can carry their own UTM-tagged links.
Direct-response tags will undercount radio’s effect, because many listeners will simply search your name or type your homepage. That is why the next step matters most.
For the full GA4 setup, see our guide to tracking radio campaign conversions in GA4.
Step 3: Measure Incremental Lift, Not Just Tagged Clicks
Incremental lift is the difference between what happened during and after the campaign and what would have happened without it. Common ways to estimate it, from simplest to most rigorous:
- Pre/post comparison. Compare the flight (plus two to four weeks afterward) with your baseline, adjusted for seasonality.
- Branded search and direct-traffic lift. Track the rise in branded queries and direct sessions. These are often the clearest fingerprints of audio.
- Matched-market test. Run the campaign in some markets and hold out comparable markets. The difference between the two groups is your lift.
- Spot-time analysis. Line up the station’s air-time log against hourly site traffic or call volume to see response spikes after spots run.
- Marketing mix modeling. For larger, always-on advertisers, a statistical model separates each channel’s contribution over time.
Whichever method you use, keep measuring for several weeks after the last spot. Audio builds familiarity that shows up later as searches, referrals and repeat visits.
Step 4: Calculate ROI – A Worked Example
Here is how the math looks for a hypothetical home-services company running a four-week campaign:
| Media cost | $6,000 |
| Production (script, voice talent) | $500 |
| Total campaign cost | $6,500 |
| Baseline leads per month | 120 |
| Leads during flight month | 165 |
| Incremental leads | 45 |
| Close rate | 25% → 11.25 incremental jobs |
| Average gross profit per job | $1,200 |
| Incremental gross profit | $13,500 |
| ROI | ($13,500 − $6,500) ÷ $6,500 = 108% |
| Cost per incremental lead | $6,500 ÷ 45 = $144 |
If those customers buy again, include their lifetime gross profit for a fuller picture of long-term ROI, and report it separately from the short-term number.
What to Include in Total Campaign Cost
Understating cost is the quickest way to overstate ROI. Add up everything the campaign required, not just the media invoice:
- Media: spots, streaming impressions, sponsorships and live reads
- Production: script writing, voice talent, music licensing, studio time and revisions
- Companion assets: banners, landing pages and social creative made for the campaign
- Tracking: call-tracking numbers, redirect setup and analytics time
- Management: agency commission or the internal hours spent planning and reporting
- Offer cost: discounts or giveaways funded by the promotion
The offer cost matters more than most advertisers expect. If a radio-only code gives 15% off, that discount reduces the gross profit of every attributed sale and belongs in the calculation.
What Is a Good ROI for Radio Advertising?
Benchmarks vary widely by category, offer and how they are measured, but independent research consistently places audio near the top of the media mix:
Notice the two very different numbers. Nielsen’s 2026 Audio Today report, drawing on its Global Compass benchmarks, puts radio’s weighted return at about $2 per dollar, behind only social media and ahead of video, display, TV and connected TV. Separate Nielsen sales-effect studies, which link radio exposure to card transactions, have averaged roughly $12 in incremental sales per dollar. Those figures measure different things (modeled return versus incremental revenue in specific studies), which is exactly why you should define your metric up front.
The same Nielsen report found that marketers rank radio last in perceived effectiveness. That gap between perception and results is an opportunity for advertisers who measure carefully.
How to Run a Simple Matched-Market Test
A matched-market test is the most convincing way for a small or mid-size advertiser to prove radio’s incremental effect without expensive modeling:
- Pick comparable markets. Choose two or more areas with similar sales history, seasonality and customer mix.
- Assign test and control. Run the campaign in the test market only. Keep every other marketing activity the same in both.
- Record the baseline. Capture at least four to eight weeks of sales, leads and web traffic in both markets before launch.
- Run a full-strength flight. Use enough weekly frequency to give the test a fair chance; a light schedule produces a weak, inconclusive result.
- Compare the change. Lift = (test-market change) − (control-market change). Use that difference, not the raw test number, in your ROI formula.
- Repeat. One test is a signal; two consistent tests are evidence you can budget on.
Streaming audio makes geographic tests easier because impressions can be targeted to selected markets while delivery data confirms where the ads actually ran.
Common Mistakes That Make Radio Look Worse Than It Is
- Running too few spots. Industry analysis of nearly 1,700 stations found most weekly radio campaigns were very light, reaching about a third of a station’s audience less than twice. See how many times a radio ad should run.
- Judging by last-click attribution. Listeners rarely click an audio ad; they search or type your URL later, which analytics often labels as direct or organic.
- Ending measurement when the flight ends. Delayed response is normal for audio.
- Weak or complicated calls to action. One clear, repeatable action beats three.
- Changing too many variables at once. If you also launch a sale, new website and social push, isolate radio with a holdout market or a staggered start.
- Ignoring daypart and station fit. See the best dayparts for radio advertising.
Short-Term ROI vs. Long-Term Brand Value
Most ROI reports capture only the sales that arrive during or shortly after the flight. Advertising also builds familiarity that makes future campaigns, referrals and even price conversations easier. Researchers in the U.K. who analyzed audio for Radiocentre reported returns on both a short-term and a full-term basis, and audio beat the all-media average on both.
Report the two separately:
- Short-term ROI – incremental profit within the flight plus a few weeks afterward. Use it to judge tactics, offers and creative.
- Long-term contribution – repeat purchases, customer lifetime value and the trend in branded search over months. Use it to decide how much to invest in always-on presence.
Cutting a campaign because its first month didn’t pay back in full can remove the very awareness that next quarter’s sales depend on.
How Streaming Audio Makes ROI Easier to Prove
Streaming radio combines radio’s listening habits with digital delivery. Because ads are served to listeners on apps, web players and connected devices, campaigns can add clickable companion banners, UTM-tagged links and delivery reporting alongside the traditional measurement methods above. That makes streaming a practical way to test radio, prove lift and then scale what works.
NextWave Broadcasting Network operates five digital music stations (New Wave Radio, Yacht Rock Radio, Rock ’n’ Roll Radio, The Alternative One! and Wild Country Radio) and publishes a network figure of 3.5 million monthly unique listeners across 302 U.S. markets (reported May 1, 2026). We help advertisers set up response paths and measurement before the first spot airs, so results are easier to read.
A Simple Radio ROI Report Template
Keep stakeholder reporting to one page. These fields cover what decision-makers need:
| Field | Example |
|---|---|
| Campaign & flight dates | Fall promotion, Sept 8 – Oct 5 |
| Stations / network and schedule | 2 stations, 45 spots per week each |
| Goal and target | 60 incremental leads under $150 each |
| Total cost (all-in) | $6,500 |
| Tagged response | Audio-channel sessions, codes redeemed, tracked calls |
| Measured lift vs. baseline | +45 leads, +18% branded search |
| Incremental gross profit | $13,500 |
| ROI / cost per lead | 108% / $144 |
| What we learned & next step | PM drive spots drove most calls; extend flight 4 weeks |
Ready to put radio to work for your business?
NextWave Broadcasting Network reaches music fans across five digital stations, with a published network reach of 3.5 million monthly unique listeners across 302 U.S. markets (reported May 1, 2026). Tell us your goal and budget and we’ll build a schedule with the reach, frequency and tracking to prove results. Email [email protected].
Frequently Asked Questions
How long should a radio campaign run before I measure ROI?
Plan for at least four weeks of airtime, and keep measuring for two to four weeks after the last spot. Audio builds awareness over repeated exposures, and some response arrives after the flight ends.
Can you track radio ads in Google Analytics?
Yes. Use a vanity URL that redirects to a page tagged with utm_medium=audio so GA4 reports it in the Audio channel, mark leads and purchases as key events, and watch direct and branded search traffic for lift that tags miss.
What is the difference between ROI and ROAS in radio advertising?
ROAS divides incremental revenue by ad spend. ROI subtracts total campaign cost from incremental gross profit and divides by total cost, so it shows whether the campaign actually made money after margins and production.
What is a good ROI for radio advertising?
It depends on your margins and offer. Nielsen’s Global Compass benchmarks place radio’s weighted return at about $2 per dollar, second only to social media, and Nielsen sales-effect studies have averaged around $12 in incremental sales per dollar.
Why does radio look weak in my analytics dashboard?
Most listeners respond by searching your brand or typing your URL rather than clicking, so last-click reports credit direct or organic search. Measure lift in those channels against a baseline to see radio’s real contribution.
Is streaming radio easier to measure than AM/FM?
Usually. Streaming ads are delivered digitally, so campaigns can add clickable companion banners, UTM-tagged links and delivery reporting on top of standard lift measurement.
How many spots do I need to measure radio ROI properly?
Enough to reach a meaningful share of the audience about three times a week. Light schedules rarely move the needle enough to measure. Research from the RAB and Westwood One found a high-impact schedule needs, on average, about 51 weekly spots per station.
Should promo-code discounts be included in radio ROI?
Yes. The discount reduces the gross profit of every sale that uses the code, so subtract it when calculating incremental profit or include it in total campaign cost.
Sources
- Radio Ink: Nielsen Audio Today 2026 on radio’s ROI and perception gap
- Summit Media: Roundup of Nielsen radio ROAS studies
- Nielsen: Radio drives return on ad spend for telco advertising
- Westwood One / RAB: How many ads should a radio station run? (2026)
- Google Analytics Help: Default channel group
- Radio Today: High Gain Audio study on audio profit ROI (Radiocentre / WPP Media)
2026 Copyright NextWave Broadcasting - Social ToothPaste Media Agency