-
play_arrow
The Alternative One Your Modern Rock Music Radio Station!
-
play_arrow
Wild Country Radio Your Hometown Country Music Station...
-
play_arrow
Rock ‘n’ Roll Radio We Play Everything That Rocks Your World!
-
play_arrow
Yacht Rock Radio Nothing but Smooth Breezes Ahead...
-
play_arrow
New Wave Radio 80s Songs You Will Not Hear Anywhere Else!
-
 play_arrow
NextWave Broadcasting Network Advertising NextWave Broadcasting Radio Group Network
 Rational Youth - Heredity
Enjoying your curated playlist from Montreal, Canada!😎
Johnnie Superstock
Rational Youth - Heredity
Enjoying your curated playlist from Montreal, Canada!😎
Johnnie Superstock
 Public Image Ltd. - Disappointed
To New Wave Radio - The greatest!!
Public Image Ltd. - Disappointed
To New Wave Radio - The greatest!!

By NextWave Broadcasting Network · Updated October 11, 2026
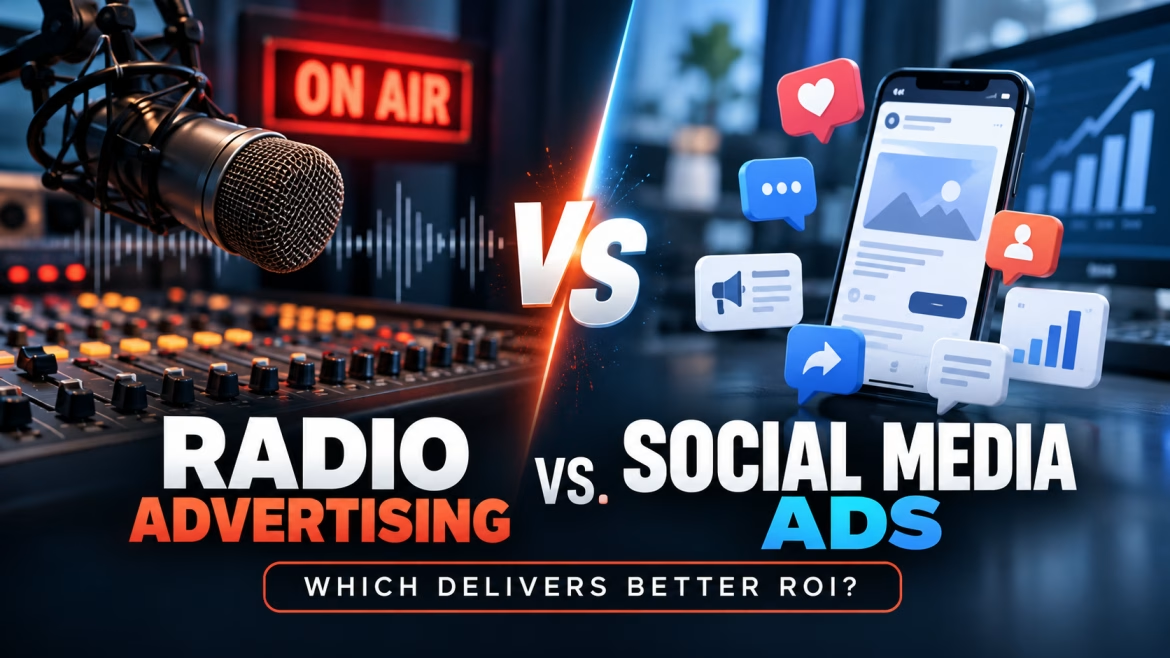
Radio Advertising vs. Social Media Ads: Which Delivers Better ROI?
Social media and radio are the two highest-returning ad channels in Nielsen’s Global Compass benchmarks: social media at about $2.22 per dollar and radio at about $2.00, ahead of video, TV, search and connected TV. Social wins on precise targeting and clickable measurement; radio wins on broad reach, listening time, low cost per thousand and the habit-driven attention of the car and workplace. For most advertisers the highest ROI comes from using both together, not choosing one.
Here is how the two compare on the metrics that matter, and how to build a mix that gets the best of each.
Key takeaways
- Nielsen Global Compass: social ~$2.22, radio ~$2.00 per $1, both ahead of all other measured channels.
- Yet only 46% of marketers rate radio as effective, versus 71% for social.
- AM/FM radio holds a 62% share of U.S. ad-supported audio time (Edison, Q2 2026).
- Audio can lift the performance of social and search when run together.
- Measure both channels with incremental lift, not last-click alone.
What the ROI Data Says
| Channel | Weighted ROI per $1 (Nielsen Global Compass) |
|---|---|
| Social media | $2.22 |
| Radio | $2.00 |
| Video | $1.56 |
| TV | $1.47 |
| $1.47 | |
| Search | $1.16 |
| Connected TV | $1.15 |
These benchmarks come from Nielsen’s marketing-mix modeling, reported in its 2026 Audio Today report and summarized by Katz Radio Group and Commercial Radio & Audio. The same research found a striking perception gap: marketers rated social media as effective 71% of the time but radio only 46% of the time, the lowest of any channel.
Other studies point the same way. Audacy’s State of Audio research reported that audio advertising outperformed social media by 13% in driving conversions. In the U.K., a WPP Media analysis for Radiocentre found broadcast radio and digital audio both returned more profit per pound than the all-media average, and campaigns that included audio saw an 8% short-term ROI uplift compared with those without it.
Radio vs. Social Media: Head-to-Head
| Factor | Radio / streaming audio | Social media ads |
|---|---|---|
| Reach model | Mass reach of a station or network audience; habitual daily listening | Algorithmic delivery to targeted users in a crowded feed |
| Attention | Ads heard in full while driving, working or relaxing; no scrolling past | Seconds of attention; easy to scroll past or skip |
| Targeting | By station format, market and daypart; streaming adds geo and device targeting | Granular interest, behavior and lookalike targeting |
| Cost (CPM) | Low per thousand; streaming audio commonly ~$8–$30 | 2026 Meta benchmarks put median CPMs in the mid-teens to about $20, higher for competitive industries |
| Measurement | Lift, vanity URLs, promo codes, call tracking; streaming adds digital delivery data | Native click and conversion tracking; prone to over-crediting itself |
| Brand safety | Curated, professionally programmed environment | User-generated environment |
| Creative | Voice, music, sonic branding and host endorsements | Visual, video, short-form and interactive |
| Best for | Building familiarity at scale, local reach, frequency, the car and the workday | Precision targeting, retargeting, direct clicks and e-commerce |
What the Same Budget Buys in Each Channel
Raw impression counts can look similar, so the difference comes down to what each impression is worth. Here is an illustrative $5,000 test using mid-range 2026 CPMs:
| Streaming audio at $15 CPM | Meta ads at $15 CPM | |
|---|---|---|
| Impressions | About 333,000 | About 333,000 |
| What an impression is | A 15–30 second message heard while the listener is in a single-stream environment | An ad served in a feed, often viewed for a second or two |
| Typical next step | Search, type the URL, visit, call | Click, like, scroll on |
| How it’s credited | Mostly indirect; needs lift measurement | Mostly direct; platform tracking |
Same number of impressions, very different exposure. That is why comparing channels on cost per click or platform-reported conversions alone tends to undervalue audio, and why incremental measurement is the fair test.
Where the Audience Actually Is
Marketers routinely overestimate streaming services and underestimate radio. In Edison Research’s Q2 2026 Share of Ear study, AM/FM radio accounted for 62% of U.S. ad-supported audio time among adults, compared with about 6% for Spotify’s ad-supported tier. In the car, AM/FM’s share of ad-supported audio was 82% overall. Nielsen’s 2026 data also shows radio reaching 89% of Americans aged 18–34 each month.
Social platforms reach huge audiences too, but much of that time is spent scrolling past ads. Radio’s strength is that its audience spends long, habitual stretches listening, which builds frequency at low cost.
Why Rising Social Costs Make Audio More Attractive
Benchmark datasets show Meta CPMs rising year over year in 2026, driven by more advertisers competing for the same feeds. As costs climb and targetable audiences saturate, each additional social dollar tends to buy less. Audio offers a different pool of attention, often at a comparable or lower cost per thousand, and it reaches people during hours when they aren’t looking at a screen at all: in the car, at work and around the house. Adding audio is one of the simplest ways to grow reach without bidding against the same advertisers in the same auctions.
Attention, Ad Avoidance and Brand Safety
Attention. Audio ads play in the background of activities people do for long stretches: driving, working, exercising, cooking. There is no feed to scroll and no thumbnail to skip past, so the message typically plays in full. Social feeds compete for every second of attention, and most ad impressions get a brief glance.
Ad avoidance. Ad blockers, skip buttons and fast scrolling are part of daily social media use. Radio listeners can change the station, but long habitual listening sessions mean a schedule with enough frequency reaches most of its audience repeatedly.
Brand safety. Professionally programmed music stations give advertisers a predictable environment. Social placements sit beside user-generated content that brands don’t control, which is why many advertisers maintain exclusion lists and brand-safety settings.
Trust and voice. Audio carries tone of voice, music and, with host reads, the credibility of a personality the audience listens to every day, which can be hard to replicate in a silent, autoplaying feed.
Why Social Often Looks Better Than It Is (and Radio Worse)
Nielsen’s own analysis warns that measurability is not the same as effectiveness. Social and search platforms can claim credit for conversions with their own tracking, while radio’s influence shows up indirectly as branded searches, direct site visits and store traffic. When budgets follow last-click dashboards, money shifts toward channels that are easiest to credit, not necessarily the ones creating demand.
The fix is to compare channels on incremental results using baselines, holdout markets or marketing-mix modeling. See how to measure radio ad campaign ROI and how to track radio campaign conversions in GA4.
How to Compare Radio and Social ROI Fairly
- Use one definition of return. Compare both channels on incremental gross profit, not platform-reported revenue for one and tagged clicks for the other.
- Use the same window. Social platforms default to short click and view windows; radio response arrives over weeks. Measure both over the full flight plus a few weeks afterward.
- Hold out where you can. Run each channel in some markets and not others, or stagger start dates, to see what each adds on its own and together.
- De-duplicate conversions. A customer who heard your radio ad, searched your name and then clicked a retargeting ad should not be counted as a full conversion by both channels.
- Look at blended cost per acquisition. Total spend across channels divided by total new customers shows whether the mix is improving.
The full measurement method is in how to measure radio ad campaign ROI.
Better Together: How Radio Lifts Social and Search
Audio and social do different jobs. Radio creates familiarity and demand; social and search harvest it. In an Australian Analytic Partners trial presented by Commercial Radio & Audio, a Nespresso radio campaign improved radio ROI 37% year over year and lifted the brand’s social results by 11%, digital video by 13% and search by 4%.
A practical way to combine them:
- Lead with radio or streaming audio to reach the full market with enough frequency. See how often a radio ad should run.
- Match the creative. Use the same offer, tagline and sonic cues in audio and social so each reinforces the other.
- Retarget on social people who visit your vanity URL or site during the flight.
- Coordinate timing so social bursts land during and right after heavy radio weeks.
- Measure the combined lift rather than each channel in isolation.
Sample Integrated Radio + Social Campaign Timeline
| Week | Radio / streaming audio | Social media | Measurement |
|---|---|---|---|
| Pre-launch | Record two :30 versions; set vanity URL | Build matching creative; set up retargeting audiences | Export baseline; tag all links |
| Weeks 1–2 | High-impact schedule, all dayparts | Light awareness posts in launch markets | Watch Direct, branded search, Audio sessions |
| Weeks 3–4 | Maintain frequency; rotate creative | Retarget site visitors with the offer | Compare markets; track cost per lead |
| Weeks 5–6 | Maintenance schedule | Push offer deadline to warm audiences | Measure combined lift; report ROI |
How Much of Your Budget Should Go to Audio?
There is no universal split, but research suggests many advertisers underinvest in audio. Radiocentre’s analysis of U.K. campaigns found total campaign ROI was maximized when audio received around 20–25% of the media budget. Treat that as a starting point to test against your own results, adjusting for your category, sales cycle and how much of your business depends on local reach.
When to Lead With Radio and When to Lead With Social
Lead with radio or streaming audio when:
- Your customers are broad (most adults in a market, or a whole music audience) rather than a narrow niche.
- You need people to know your name before they need you: home services, healthcare, legal, auto, financial services.
- Your offer is local or regional, or you are entering new markets.
- Social costs are rising and response is flattening because you have saturated your targetable audience.
Lead with social when:
- Your audience is narrow and precisely definable by interest or behavior.
- You sell online with a short path from impression to purchase.
- You depend on visual demonstration, user reviews or creator content.
- You are retargeting people who already know you.
Most growing businesses benefit from both: radio expands the pool of people who know you, and social converts more of them.
Creative That Works in Each Channel
| Radio / audio creative | Social creative |
|---|---|
| One clear message and one call to action per spot | Stop the scroll in the first one to two seconds |
| Say the brand name early and repeat it | Show the brand or product visually from the start |
| Use a memorable, easy-to-spell vanity URL | Design for sound-off viewing with captions |
| Consistent voice, music or sonic logo across versions | Test multiple visuals and hooks; refresh often |
| Host reads add trust and personality | Creator and customer content add social proof |
Keep the offer, tagline and timing identical across both so each exposure reinforces the other.
Bringing Audio and Social Together with NextWave
NextWave Broadcasting Network combines streaming audio across five music formats with station and show sponsorships, website placements, sponsored content and social promotion, so a single campaign can reach listeners in the stream and again online. Our published network reach is 3.5 million monthly unique listeners across 302 U.S. markets (reported May 1, 2026).
Ready to put radio to work for your business?
NextWave Broadcasting Network reaches music fans across five digital stations, with a published network reach of 3.5 million monthly unique listeners across 302 U.S. markets (reported May 1, 2026). Tell us your goal and budget and we’ll build a schedule with the reach, frequency and tracking to prove results. Email [email protected].
Frequently Asked Questions
Is radio advertising better than social media advertising?
Neither is universally better. Nielsen’s benchmarks put social media slightly ahead at about $2.22 per dollar and radio at about $2.00, both ahead of every other measured channel. They do different jobs, and combining them usually produces the best results.
Is radio advertising cheaper than Facebook ads?
On a cost-per-thousand basis, radio and streaming audio are often comparable or lower. Streaming audio CPMs are commonly about $8 to $30, while 2026 Meta benchmarks put median CPMs in the mid-teens to around $20.
Why do marketers underestimate radio?
Radio’s impact shows up as searches, direct visits and store traffic rather than clicks, so attribution dashboards under-credit it. Nielsen found only 46 percent of marketers rate radio as effective despite its high measured ROI.
Can radio ads improve my social media results?
Yes. Cross-channel studies have found that radio lifts the performance of social, video and search, because listeners who hear your brand are more likely to recognize and engage with your social ads.
How should I split my budget between radio and social?
Start from your goals and test. U.K. research from Radiocentre found campaign ROI peaked when audio received around 20 to 25 percent of the media budget.
How do I compare radio and social fairly?
Measure incremental results for both channels using baselines, holdout markets or marketing-mix modeling instead of comparing platform-reported conversions with radio’s tagged clicks.
Do radio ads work for younger audiences?
Yes. Nielsen’s 2026 data shows radio reaching 89 percent of Americans aged 18 to 34 each month, and streaming radio reaches them on phones and connected devices.
Is social media advertising more measurable than radio?
It is easier to track clicks, but platform tracking tends to credit itself. Radio can be measured with vanity URLs, codes, call tracking and lift analysis, and incremental tests are the fair way to compare both.
Sources
- Radio Ink: Nielsen Audio Today 2026
- Radio Ink: Katz Radio Group on radio’s ROI vs. perception
- Commercial Radio & Audio: CMO perception vs. ROI reality
- RBR: Radio leans on ROI data at Cannes Lions (Audacy State of Audio)
- Radiocentre: High Gain Audio ROI report
- Radio Online: Edison Q2 2026 Share of Ear analysis
- WorldDAB: HEARD 2025 Analytic Partners radio ROI (Nespresso)
- AdManage: Facebook CPM benchmarks 2026
- Coupler.io: Facebook Ads statistics 2026
2026 Copyright NextWave Broadcasting - Social ToothPaste Media Agency